In addition to the generic configuration, there are additional
parameters for the Ranger Audit Profiler that can
be optionally edited.
-
Go to Profilers and select your data lake.
-
Go to .
-
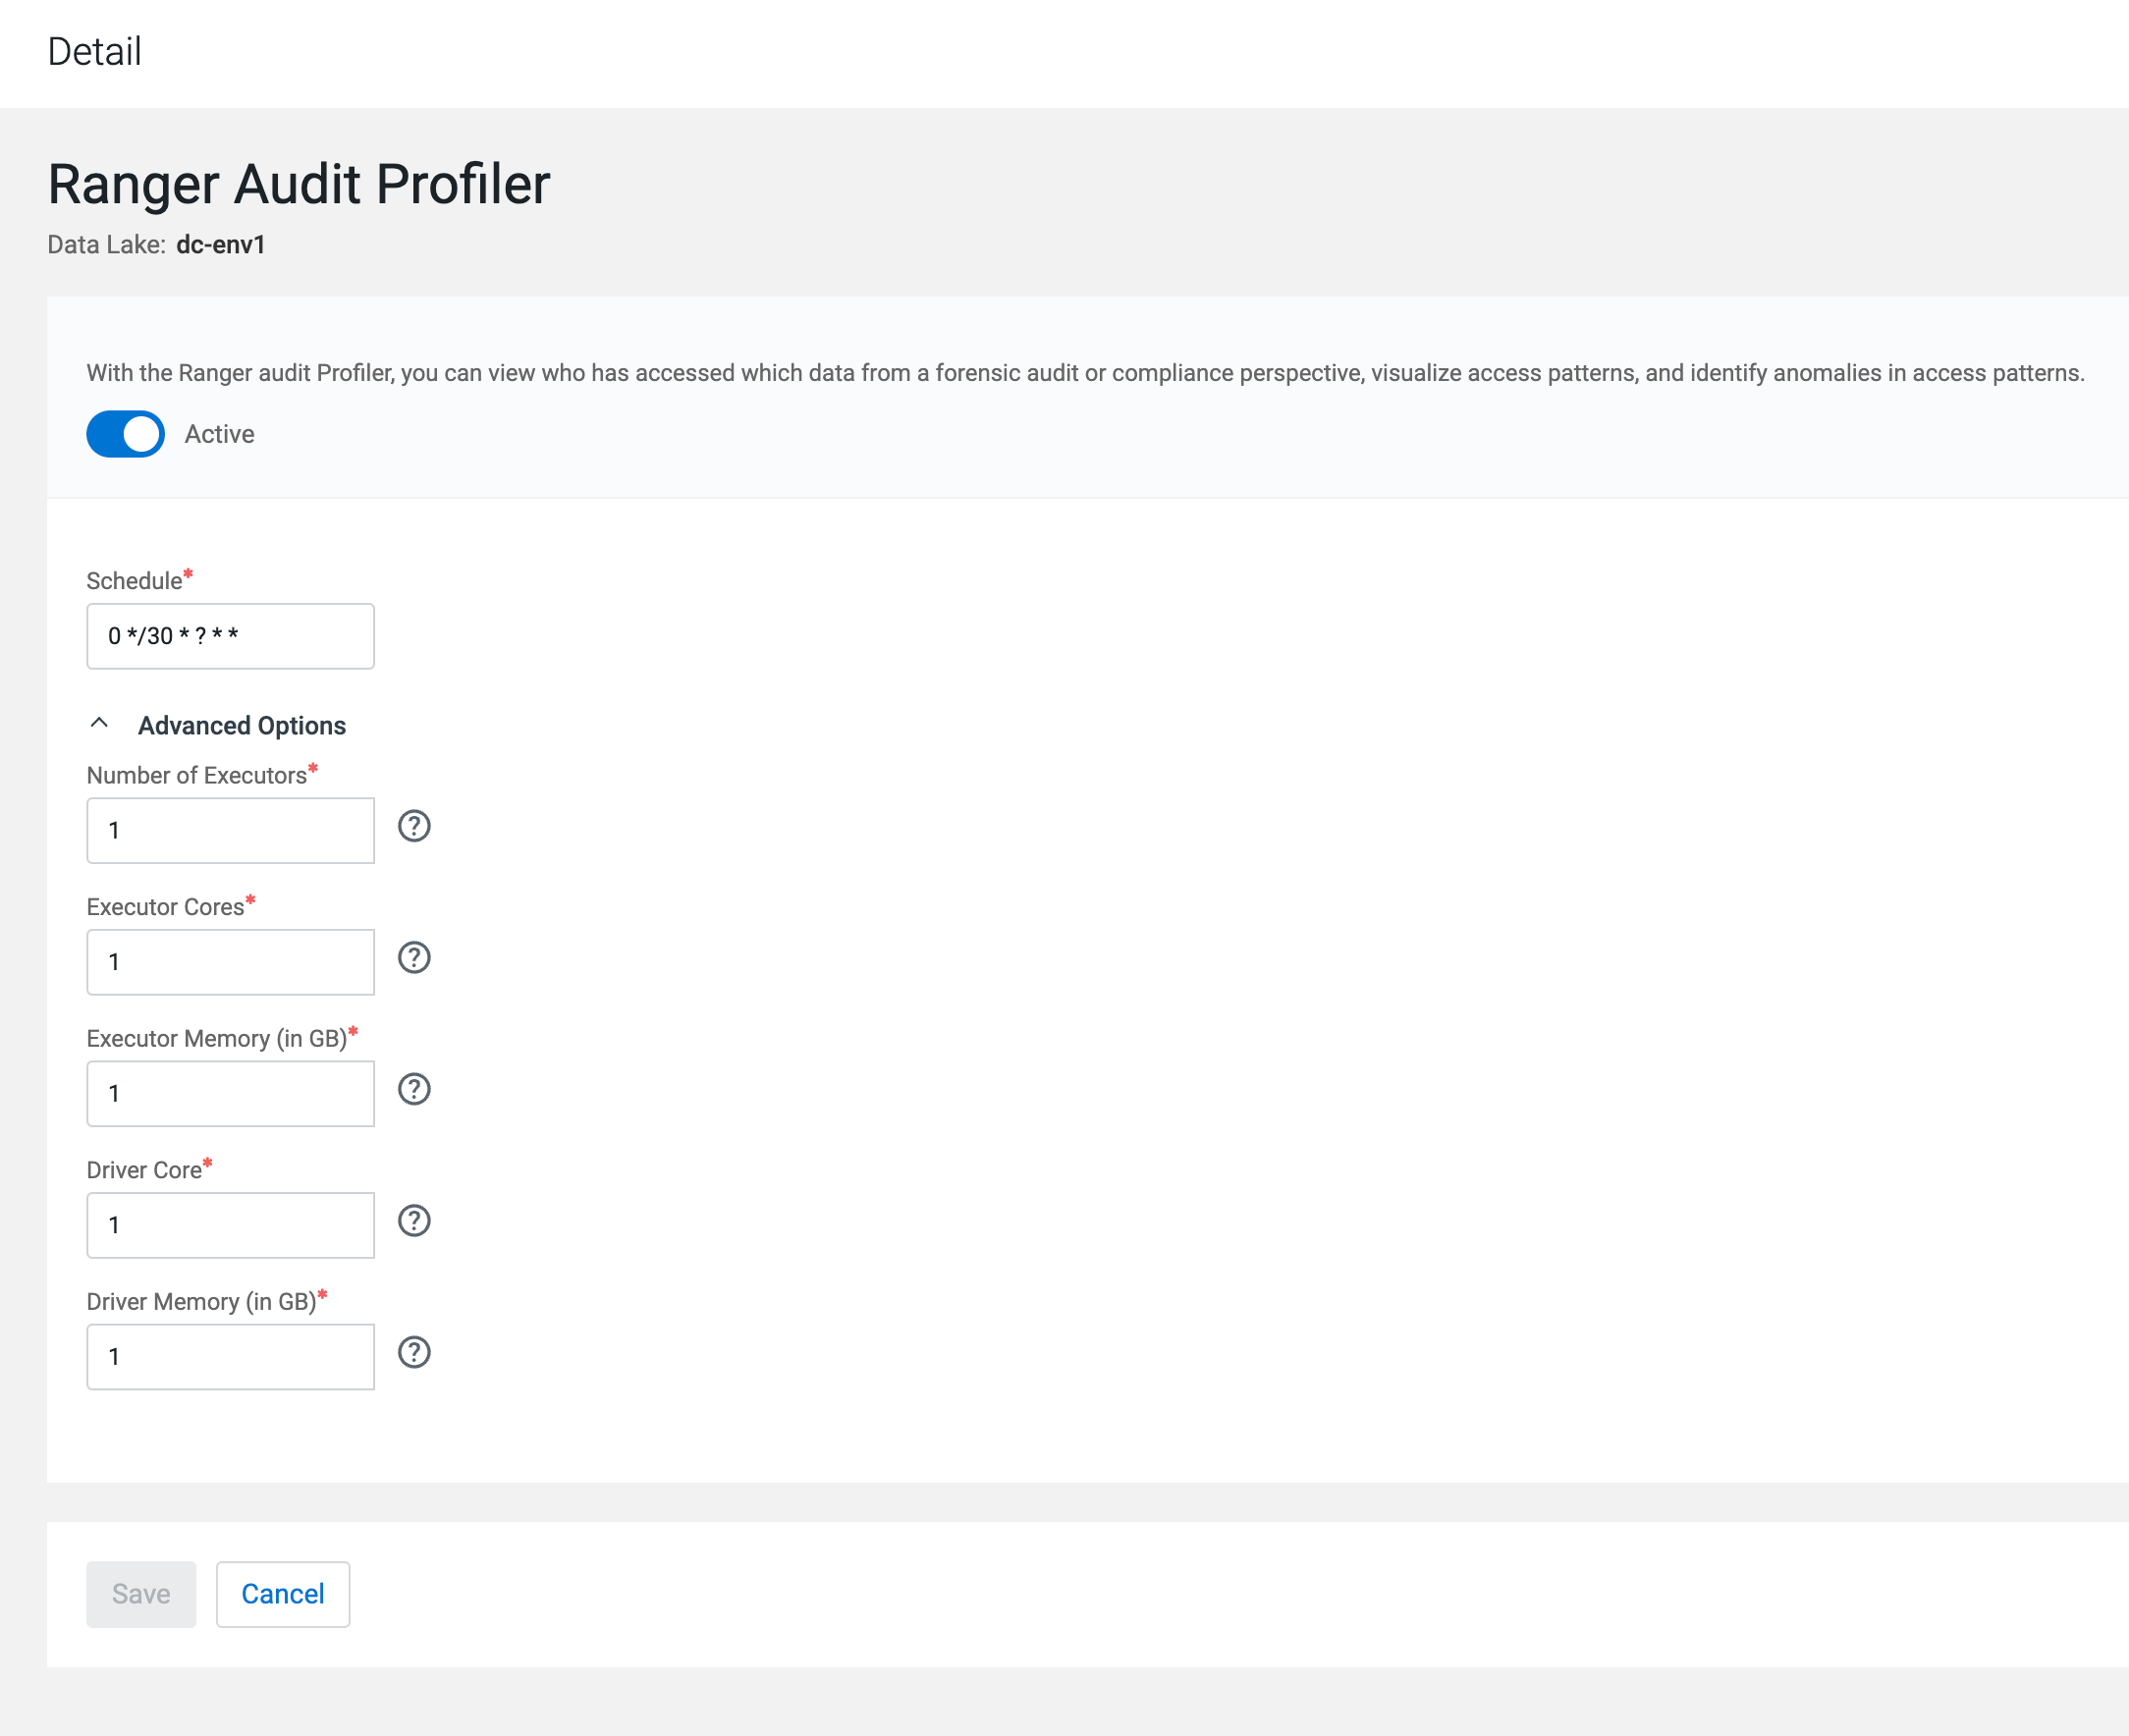
Select Ranger Audit Profiler.
The Detail page is displayed.
-
Use the toggle button
 to enable or disable the
profiler.
to enable or disable the
profiler.
-
Select a schedule to run the profiler using a quartz cron expression.
-
Continue with the resource settings.
- In Advanced Options, set the
following:
- Number of Executors - Enter the number of
executors to launch for running this profiler.
- Executor Cores - Enter the number of
cores to be used for each executor.
- Executor Memory - Enter the amount of
memory in GB to be used per executor process.
- Driver Cores - Enter the number of cores
to be used for the driver process.
- Driver Memory - Enter the memory to be
used for the driver processes.
-
Click Save to apply the configuration changes to the
selected profiler.