Tracking profiler jobs in VM-based environments
Use the Profilers > Jobs page for tracking the respective profiler jobs.
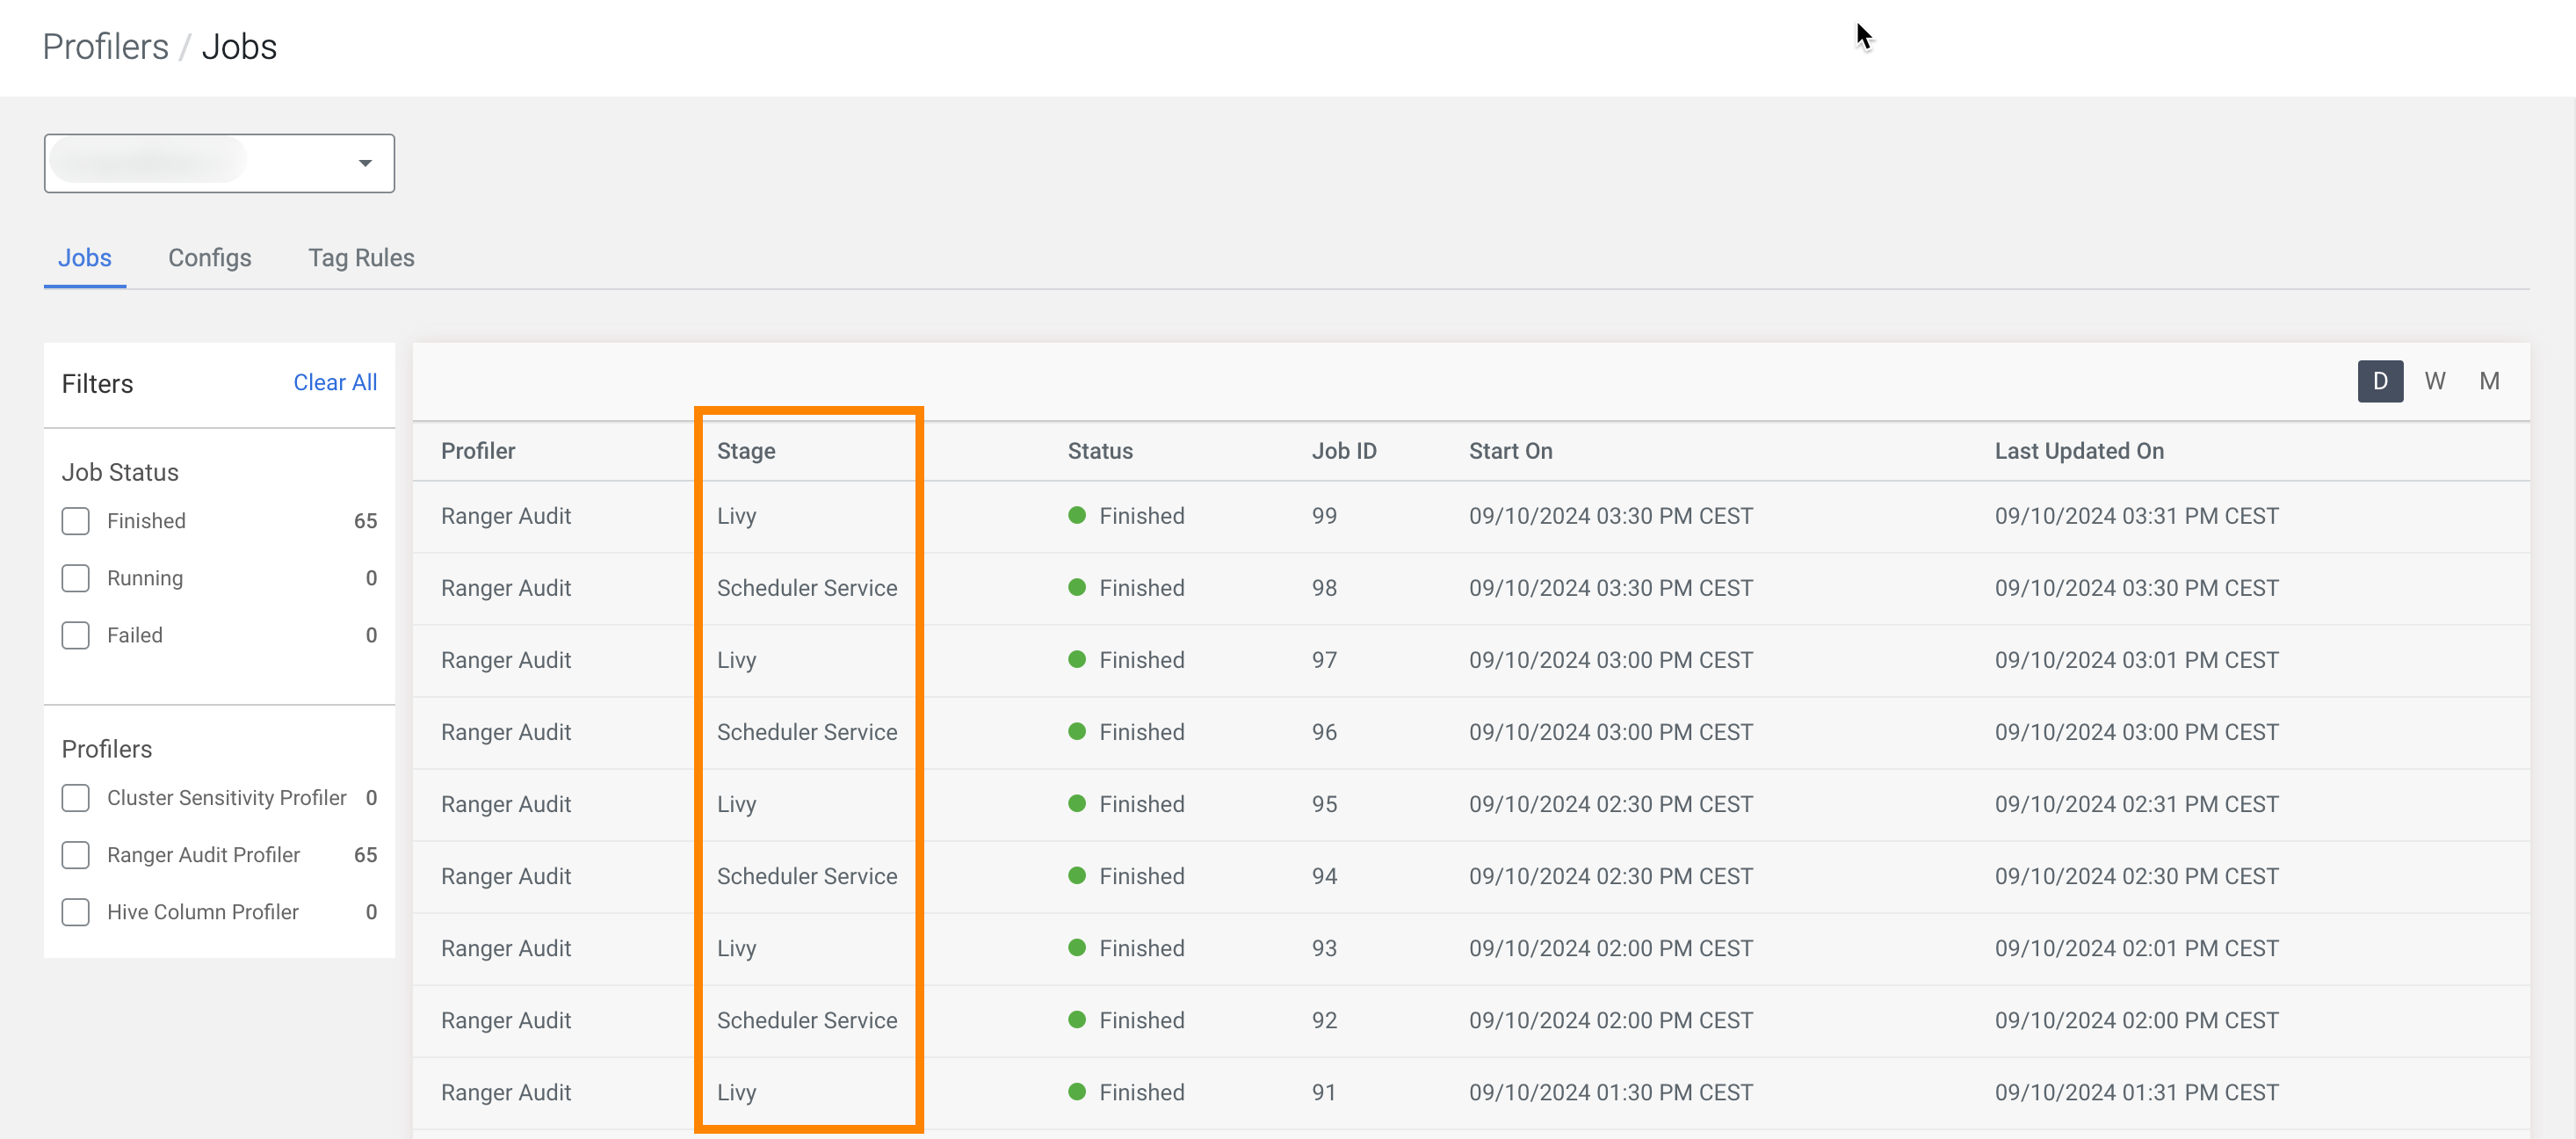
Under , you can have an overview of your started profiler jobs. By using the D, W, M filters, you can go back up to a day, week or a month, to see your previous jobs. Use this page to quickly check if your profiler jobs are failing.
In VM-based environments, can show you the current profiling Stage based on the relevant service used:
For each profiler job, you can view the details about:
- Profiler type
- Profiler Status
- Stage (for VM-based environments)
- Job Status
- Job ID
- Start Time
- Last Updated On
Using this data can help you to troubleshoot failed jobs or even understand how the assets were profiled and other pertinent information that can help you to manage your profiled assets.
In VM-based environments, profiler job runs in the following phases:
- Scheduler Service - The part of Profiler Admin which queues the profiler requests.
- Livy - This service is managed by YARN and is used to submit the Apache Spark jobs after which the actual asset profiling takes place.
- Metrics Service - Reads the profiled data files and publishes them.