Lineage Diagram Icons
Entity Types and Icons Reference
In lineage diagrams, entity types are represented by icons that vary depending upon the source system. The table below lists source system and shows the icons that can display in lineage diagrams.
Lineage diagrams are limited to 400 entities. After 400 entities, Cloudera Navigator lineage diagrams use the hidden icon to provide an entry point for exploring additional entities.
| Cluster | |
 |
Cluster group |
 |
Cluster instance |
| HDFS | |
 |
File |
 |
Directory |
| Hive and Impala | Hive entities include tables that result from Impala queries and Sqoop jobs. |
 |
Table |
 |
Field |
 |
Operation, sub-operation, execution |
 |
Impala operation, sub-operation, execution |
| MapReduce and YARN | |
 |
MapReduce operation and operation execution |
 |
YARN operation and operation execution |
| Oozie | |
 |
Operation, operation execution |
| Pig | |
 |
Table |
| Pig field | |
| Pig operation, operation execution | |
| Spark | Supported in CDH 5.11 (and higher). Spark lineage is rendered only for data that is read/written or processed using the Dataframe and SparkSQL APIs. Lineage is not available for data that is read/written or processed using Spark RDD APIs. Metadata extraction for Spark can be enabled or disabled. See Configuring and Managing Extraction for details. |
 |
Operation, operation execution. (Spark RDDs and aggregation operations are not included in the diagrams.) |
| Sqoop | |
 |
Operation, sub-operation, execution |
| S3 | |
 |
Directory |
 |
File |
 |
S3 Bucket |
Other Icons and Visual Elements in Lineage Diagrams
 |
Hidden entities. Used in lineage diagrams containing more than 400 entities. Click this icon to display the hidden entity details. See Exploring Hidden Entities in a Lineage Diagram for more information. |
 |
Placeholder for an entity that has not yet been extracted. This icon is replaced by the correct entity icon after Cloudera Navigator extracts and links the entity. Hive entities deleted from the system before extraction completes also use this icon, in which case, the icon remains in the lineage diagram. |
 |
Plus icon. Click this icon in a lineage diagram to see more information about the entity. |
See Metadata Extraction and Indexing for more information the extraction process, including length of time to extract newly created entities.
Types of Relations Shown in Lineage Diagrams
Lineage diagrams render relationships between entities using different line styles and colors. Arrows indicate data flow direction. Cloudera Navigator supports the following types of relations:
| Relation Type | Description |
|---|---|
| Data flow | A relation between data and a processing activity, such as between a file and a MapReduce job or vice versa.
Sometime you may see a data flow relation without data assets. If that happens, it may be because they've been deleted. Turn on Deleted Entities in the lineage view to see the original data assets. |
| Parent-child | A parent-child relation. For example, the relation between a directory (parent) and a file (child). |
| Logical-physical | The relation between a logical entity and its physical entity. For example, between a Hive query and a MapReduce job. |
| Instance of | The relation between an operation execution and its operation. Instance of relations are not rendered in lineage diagrams. |
| Control flow | A relation in which a source entity controls the data flow of the target entity. For example, the relation between the columns of an insert clause and the where clause of a Hive query. |
 |
A solid line depicts a data flow relationship, indicating that the columns appear (possibly transformed) in the
output (when line has directional arrow) and logical-physical (when line does not have an arrow). For example, a solid line appears between the columns used in a select
clause.
If you don't see the data assets involved, it may be because they've been deleted. Turn on Deleted Entities in the lineage view to see the original data assets. |
 |
A dashed line depicts a control flow relationship, indicating that the columns determine which rows flow to the output. For example, a dashed line appears between the columns used in an insert or select clause and the where clause of a Hive query. Control flow lines are hidden by default. See Filtering Lineage Diagrams. |
 |
A blue line depicts a link within the lineage diagram that has been selected. |
 |
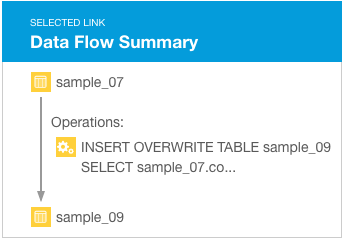
A green line depicts a summary link that contains operations. When clicked, the green line turns blue denoting it has been selected, and the nested operations display in a selected link summary. |
Categories: Data Management | Governance | Lineage | Navigator | All Categories
